Interactive Maps with CSS
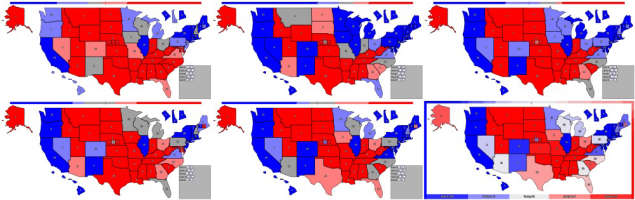
It is possible to create some nice interactive maps without using any JavaScript if that is something you want to do, but whatever your goals are there are probably better ways to accomplish them.
I will be making an Electoral College map, but other maps are possible if you know what to change. I created an SVG map of the United States from this project and want to let users click on states to change the color and update some statistics.
Label Clip-Path
I want each state to be clickable so I will add a group of labels for each state. Each possible color for each state needs its own label that refers back to a unique radio button. To get these labels to fill the shapes of geographic regions, I set the clip-path url to a clipPath element defined in the svg.
The units for the clip path are pixels so 1 pixel needs to equal 1 SVG unit. We could use objectBoundingBox but then the units are fractions of the width and height so the SVG paths would need to be adjusted. Instead I will create labels with size in pixels matching the viewBox and then use transform to scale the element to match the SVG.
{% for name, item in regions %}
<div id="label-{{name}}" style="clip-path: url(#clip-{{name}});">
    <label class="color1 color1-{{name}}" for="color1-{{name}}" ></label>
    <label class="color2 color2-{{name}}" for="color2-{{name}}" ></label>
    <label class="color3 color3-{{name}}" for="color3-{{name}}" ></label>
</div>
{% endfor %}
I want to also create SVG paths for each state to generate the borders (and text labels, but that could be part of the label). To avoid sending duplicate path data, you can use the <use> element.
Once you have clipped the labels, the logic of changing the color of a state is simple. We will just rotate through the labels. When color 1 is selected we will display the label for color 2, but we want that button to have the first color. We repeat until the final color has the label for color 1 again.
#labels > div > label:Not(.color1) {
    display: none;
}
.color1 {
    background: var(--color3);
}
.color2 {
    background: var(--color1);
}
.color3 {
    background: var(--color2);
}
{% for name, item in regions %}
.color1-{{name}}:checked ~ #labels label.color2-{{name}} {
    display: block;
}
.color2-{{name}}:checked ~ #labels label.color3-{{name}} {
    display: block;
}
{% endfor %}
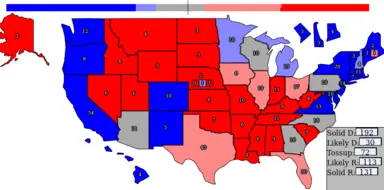
At this point we have a simple working map with some randomly pre-checked inputs for variety. This repl has the code to generate something similar. Click the states below to rotate between blue, grey, and red.
Computing Sums
I'm going to use two different techniques to display the totals for each category. At the top will be a bar that visually showcases the status of the race. In the bottom right the exact numbers of electoral votes of each color will be displayed.
For the bar at the top we will create a flex element. Then we will add 538 elements inside. Each state will control exactly as many of these elements as it has electoral votes. When the color of a state changes we will change the color of these elements as well. Crucially we will also change the order property of these elements so that all elements of the same color remain together to make the visualization useful.
{% for name, item in regions %}
    {% for c in colors %}
    .color{{loop.index}}-{{name}}:checked ~ .map-container #info .visual-{{name}} {
        background: var(--color{{loop.index}});
        order: {{loop.index}};
    }
    {% endfor %}
{% endfor %}
To display the correct number we will create elements with each possible number (0-538) and then make sure that the correct number is shifted into a visible area. To shift the correct amount, we create elements for each state with widths corresponding to their number of electoral votes. If the state is a different color then we hide these elements so that the total width of the visible elements corresponds to the sum.
The CSS will only display the span of the selected color.
{% for name, item in regions %}
	{% for c in colors %}
	.color{{loop.index}}-{{name}}:checked ~ .map-container #info #blocker-{{loop.index}}-{{name}} {
    	display: inline-block;
	}
	{% endfor %}
{% endfor %}
The HTML will look like this for the first color output.
Color 1:
<span class="scoreHolder">
    <span class="scoreInner">
        {% for name, item in regions %}
        <span id="blocker-1-{{name}}" class="blocker" style="width: calc(48px * {{ item['ev']}});">
        </span>
        {% endfor %}
        {% for i in range(0,538+1) %}
        <span class="score">{{538 - i}}</span>
        {% endfor %}
    </span>
</span>
Then just position everything so that the correct number is visible. Only the 539th set of 48px chunks in the .scoreInner span will be visible. When all of the .blocker spans are visible this chunk will be the first .score span which displays the number 538. As spans are removed the number visible decreases by the same amount.
.scoreHolder {
	width: 48px;
	overflow: hidden;
}
.scoreInner {
    width: calc((538 + 1) * 48px);
	right: 0px;
	overflow: hidden;
}
.score {
    width: 48px;
}
Our map is now quite nice to use. The only thing this map is missing is proper handling of Maine and Nebraska, but adding a few more rectangles in the right place will solve that later.
Final Product
For the code to generate everything, see this repl. The /createCSS url gives you a few options to change the set of colors or the default values and then the form is posted to generate the map.
There is also a JavaScript version that adds the ability to change colors by dragging left or right.